Investment Property in Sydney, Melbourne, Brisbane, Perth
Property Investment education research eBook investment property specialists free advice to investment
Education on property investment strategy eBook Information
Australians have trusted property as their favoured investment vehicle for
generations – and With good cause:
| We understand property. | |
| We recognise its cyclic nature | |
| We recognise the incredible advantage that appropriate leverage (borrowing) offers, |
|
| We recognise the benefits of rent return | |
| We recognise the benefits of taxation relief in servicing those borrowings, | |
| We recognise the significant profits consistently achieved over time. |

Over the last 40 years, in the Melbourne, Sydney, Brisbane and Perth markets, we have been reminded of property’s cyclic nature. In Melbourne and Sydney, for example, we witnessed extraordinary growth in the late 1990’s and the early 2000’s. In fact, according to Australian Bureau of Statistics, the average growth in Sydney from 1996 to 2003 was 140% and in the same period in Melbourne it was a staggering 160%. For those lucky investors who bought median priced investment property in these markets in the late 1990’s for under $200,000, they witnessed capital growth of around $300,000 by 2003/4. More recently, Sydney has witnessed around 90% price growth increase between 2010 and 2015 and Melbourne a further 50%+ growth.
The other side of the coin, however, was those who chose to invest in Sydney in late 2003/4. The median house price was $510,000 by the end of 2003. Then 2003 saw growth of around 23% and most appeared confident of continuing growth. However, six years later, in December 2009, the median price in Sydney was $546,000; just an average $6,000 per annum growth on a $510,000 investment, or just over 1% growth per annum. A similar situation was witnessed in Melbourne during the same period, with the exception of a relatively small, ($40,000 on median price), 18 month growth phase during 2008/9.
The obvious but incorrect conclusion for most in Sydney and Melbourne for the best part of this century is that property is no longer the ‘dependable’ investment class it once was. The tens and even hundreds of thousands of dollars in annual growth is just not there anymore!
The reality in Australia is a little different from the “local knowledge base” most Real Estate agents and property investors tend to work from. If we go back to 2003 and look at the median prices in Brisbane and Perth, we find that a good median-priced property could be purchased for around $175,000 and $200,000 respectively. By December 2009, the same median-priced property in Brisbane would now sell for $410,000 and in Perth $480,000 (in the latter case a drop from $500,000 the previous year). In other words, over 100% plus growth was achievable in the Australian property market while, at the same time, Sydney could not demonstrate much more than 1% annual growth.
The above examples are based on capital cities only. At various stages of these specific city/state-based growth cycles and flat years within the cycle, we have also witnessed huge growth in many regional cities; particularly those that appear to be developing quickly from large country towns to major metropolitan regional cities with diversifying economies.
It is a common impression that property in Australia has been doubling in value every 7-12 years. If we take every 10 years as a conservative average, this would mean that property is growing in value at an average rate of 7.2% per annum. Three issues become very apparent from this fact:
(1) Property does not increase in value at a steady, even 7%-8% each year. For many years in any one marketplace we can anticipate little to no growth at all. In some cases this can be followed by two years of 100% plus growth, (as witnessed in Sydney and Melbourne in 1988/89 after an almost 8 year period throughout the 80’s with virtually no growth).
(2) If property is demonstrating these cyclic growth “spurts” and it is doubling every 10 years, if we buy our first investment in our own state/city at the age of 30, then we only have THREE really good opportunities in our life-time (by age 60) to make good growth by investing at the beginning of one of these growth cycles in our own state/city market.
If we are to be successful investors, building a property portfolio large enough to support us and our families in retirement, it is essential to look at diversification of the portfolio into markets outside our local area.
Logic dictates that as successful property investors we MUST remind ourselves of the cyclic nature of property growth – – of the benefit in understanding the dynamics of supply and demand, the significance of vacancy levels and rental yields as indicators of inevitable market maturation of being market aware, rather than responding to popular ideology.
With timing of market entry aside, serious investors know, trust, and consistently financially benefit from property’s unique capacity to assist us in individual wealth creation. Over the past 30-40 years, residential property price growth in the three east coast mainland capitals and Perth in the west has averaged better than 8% p.a compounded – fairly predictable over most 10-12 year periods. Tied to appropriate leverage, this has offered ordinary Australians the key to developing extra ordinary wealth.
| Historical Price Growth Patterns – Sydney, Melbourne, Brisbane and Perth |
| Market | 1975 Value | 2015 Value | Total Price Growth |
| Sydney | $19,900 | $1,034,000 | 8.8% p.a. |
| Melbourne | $11,800 | $734,300 | 9.2% p.a. |
| Brisbane | $8500 |
$511,300 | 9.1% p.a. |
| Perth | $22,600 |
$590,000 | 7.3% p.a. |
| • Source BIS Shrapnel, Australian Bureau of Statistics | |||
Notes:
|
| How do we realise our investment gains? |
| Everyone will want to achieve different outcomes. To some, cash is king – to others available equity, to others liquidity.
There are obviously many variables in structuring our portfolios, and in determining the likely financial outcomes. And of course it depends on the size, structure and quality of the portfolio achieved – and the time it is held. |
The key is to build assets while you are earning. Once you have developed a substantial asset base, you can decide the most appropriate outcome for you in your circumstances.
Many investors, who have developed solid portfolios over 15-20 years, are able to comfortably retire on the after tax proceeds (rental) of their portfolio incomes – while retaining the full capital invested for future equity growth. Others enjoy after tax income, but inadequate levels without further injection. This usually necessitates the sale of one or more properties to reduce borrowings on the remaining portfolio, leaving excess proceeds to either bank or drawdown over time to supplement after tax rental incomes.
Others may merely invest in one or two properties with the inevitable outcome of eventually selling, paying capital gains tax, and drawing down on the proceeds over time (with or without PAYG tax).
Footnotes:
|
Timeframes and objectives vary widely. But ultimately the outcomes rest with each of us individually, in the commitment we have in developing our portfolios over the years.
A typical example of a well constructed portfolio
| 20 year portfolio development (say 1984-2004) | |
| 8 properties acquired and held | |
| Total portfolio value over 20 years $3.340 million | |
| Total equity (wealth) created $2.335 million | |
| This example is absolutely normal – it involves the ongoing acquisition of average market | |
| value properties consistently over 14 years. |
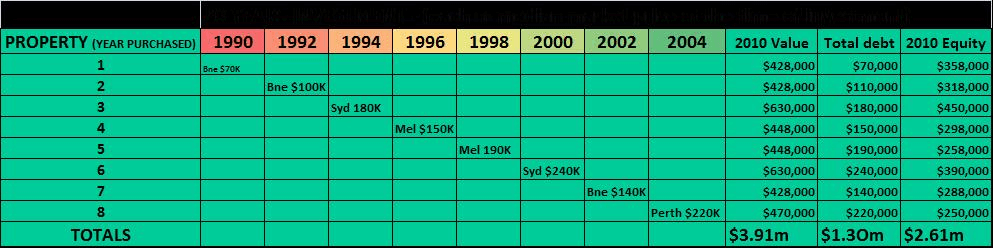
* These values and years represent actual market averages recorded by REIA and ABS reported by BIS Shrapnel
* The geographic sequence of investments follows the cyclic patterns of recorded historical price growth.
* The chart assumes 100% borrowings, interest only funding, and no repayment of outstanding principal.
* It does not reflect annual operating cash flow – conservatively assumed to break even over time.
*Acquiring eight properties over 14 years implies the ability to service the debt, and should not automatically be assumed that all investors would achieve this number of properties.
Key Issues:
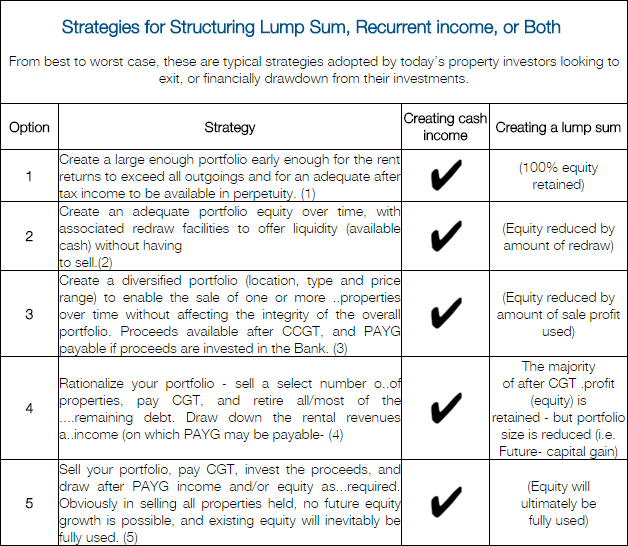
| Having modestly invested in eight properties over 20 years, this happy investor is sitting on some $2.61 million equity in 2010. | |
| The decision as to how to exit, or to gain cash flow or liquidity is not difficult. | |
| Being a well diversified portfolio, with both price and equity variance, there are many Options:- |
|
|

The options are endless. The key is to develop a portfolio enabling the flexibility, and offering the substantial equity or ongoing income as depicted.
It should be emphasised that this is not an extra ordinary example. It involves a modest number of properties, a modest total investment, and a spread of properties that were average market price when acquired. It is a real life possibility for many Australians to create such a portfolio.
| Developing Your Successful Property Investment Portfolio | |
| The equity growth possible in your portfolio largely depends on five variables:- | |
| The total value of properties invested in | |
| The leverage applied (the level or percentage of borrowing) | |
| Time in the market – (an absolute key) | |
| Your individual tax position (and potential cash flow contribution) | |
| Timing of entry into the market (of lesser impact) | |
| The key issues to address in your portfolio development are:- | |
| Ownership vehicle – related to tax, risk and cash flow issues | |
| Portfolio diversification (location, type, price range, targeted demographic) | |
| Consistent multiplication (utilising equity growth as the foundation security for additional investments) |
|
| Funding capacity (dependant on your personal income and tax position, your effective disposable income, rental yields and vacancy patterns, and interest rates) |
|
| Provision of adequate safety nets – to provide for cash flow fluctuations related to vacancy, rental revenue variation, interest rate increases, employment loss/change etc. | |
It is essential to take the appropriate advice on all of the above variables, to ensure the most productive and risk-averse portfolio development. It is not unusual for ordinary investors to accumulate well in excess of eight properties over a 20 year timeframe. And the resultant financial flexibility and cash flow outcomes can be exceptional.
The key is in being committed to invest as frequently as the market and your individual finances allow, to patiently build your portfolio over time, and to be constantly vigilant for both new opportunities, and potential problems to address.
Lime Property Solutions has over 26 years experience in assisting property investors understand all of the above, and as importantly, understanding how to pick a property market poised for growth. Free in-home consultations are available. In this consultation you can review the data on which Lime makes the decision on which market to invest in today.
For more personalised information please send us your details here, click here
Disclaimer:
Lime Property Solutions, and Hugh Frame are not Financial Planners, Accountants, or Tax Advisors. The author does not intend information in this article to be used as advice, but as material to discuss with your relevant professional advisors. All information quoted is drawn from typical property investment scenarios in the mentioned time frames.